Risk is always present in markets, sometimes it shows up in much more visible ways. This month, the conflict in Iran is front and center in the minds of investors and is reminding us why markets rarely move in straight lines. Clearly, the impact on oil prices has weighed on the stock market as we try to process what this means for the future of our financial picture.
An “Inflationary Correction” Takes Shape
Since the start of the Iran conflict, markets have experienced the possible beginnings of an “inflationary correction,” where both stocks and bonds decline as inflation expectations and interest rates rise. We experienced an inflationary correction in 2023, but the drivers were different. Inflation in 2023 stemmed largely from an increase in the money supply during the pandemic resulting in strong demand for consumer goods, as well as supply chain disruptions from the pandemic. In our opinion, the Federal Reserve also kept interest rates too low for too long and in 2023 performed (arguably) the most dramatic interest rate policy reversal in U.S. history.
However, today’s pressures are primarily supply-driven, with higher oil and commodity prices increasing the costs of many other areas of the economy. While this has pushed interest rates higher and pressured prices, the absence of a significant money supply surge suggests bond market disruption will be less severe than in 2023.
Oil Spikes and History
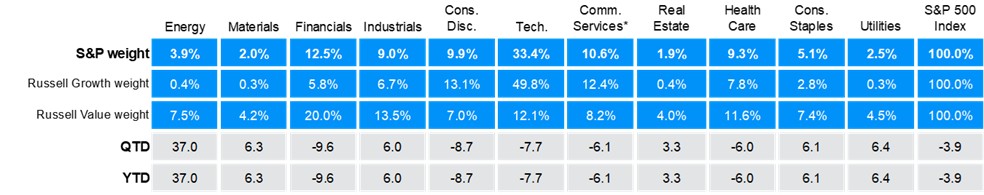
Oil prices are central to current market reactions, as higher energy costs can pressure consumer spending and corporate profits. Historically, some sectors benefit from rising oil prices, while consumer-facing industries often face headwinds. The chart below shows that so far, this episode is no different. It lays out year-to-date returns (through 03/24/2026), with Energy leading the market (by far) and Consumer Discretionary dragging (focus on the bottom YTD row). This appears to be the market pricing in the potential impact on the wallets of the American consumer.
2026 Returns by Sector1
Past oil price spikes have not always coincided with a recession, but when they did, they were far from the sole cause. Broader conditions such as monetary policy, labor markets, and overall financial stability typically determine whether higher energy prices lead to a contraction of the economy.
Currently, the economic backdrop includes modest GDP growth, mixed labor data, and inflation that remains above the Fed’s target. This combination warrants attention but does not automatically signal a recession driven solely by oil prices. Headlines can make it feel like markets are in free fall, but recent declines remain modest compared to historical corrections and bear markets. It’s important to remember:
- Intra-year declines are common, even in years that finish with positive returns.
- The current pullback is well within historical ranges that have not derailed long-term returns. (Note from the chart below, the average intra-year drop has been 14.2% while thus far we are down ~7% from our highs.)
- Investors appear to be pricing in a disruption rather than a prolonged crisis.
Annual Returns and Intra-Year Declines2
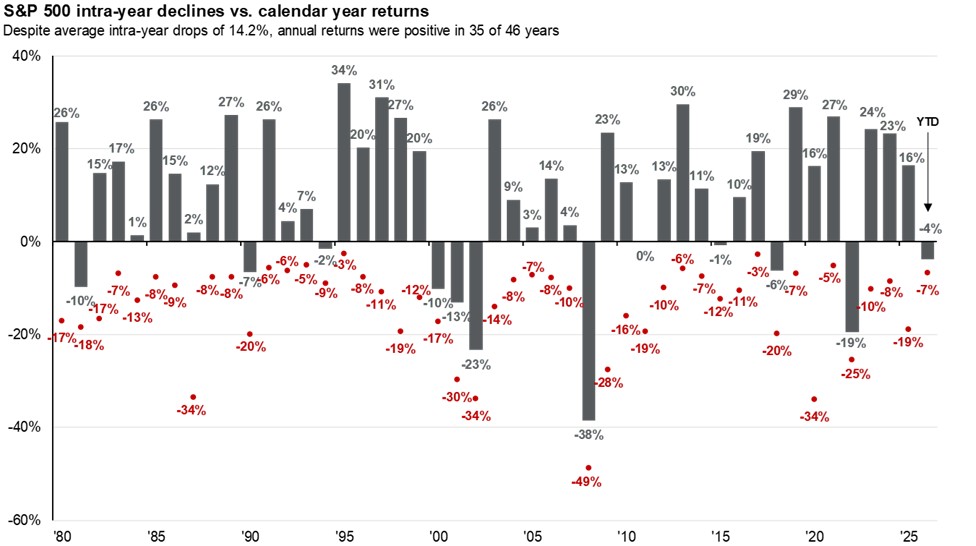
We use the graphic above frequently to paint a great picture in times of both high AND low volatility. Through March 30th of this year, the S&P 500 is still well within range of average volatility. Given that it is also a mid-term election year, additional volatility throughout 2026 would not surprise us. Also, although large daily moves can feel dramatic, they are more common than many realize. Historically, the S&P 500 experiences about 29 days per year with declines greater than 1%. Through March 30, we’ve seen 10 such days, putting 2026 roughly on pace with an average year. From a statistical perspective, current volatility is not unusual.
Avoid Turning Your Portfolio into a Geopolitical Bet
When uncertainty increases, it can be tempting to adjust portfolios or move in and out of markets based on predictions about the war, but doing so requires guessing outcomes that even policymakers struggle to forecast, including:
- Duration and scope of the conflict
- Potential expansion into a broader regional war
- Disruptions to shipping routes like the Strait of Hormuz
- Responses from major global powers
- The timing of market pricing adjustments
Remember any bad news we know today is likely already priced into the market. Therefore, building a long-term plan around unknown geopolitical outcomes is speculation, not strategy. As investors, we cannot control wars, oil prices, or interest rate policy, but we can control our response. That includes:
- Confirming your time horizon and risk tolerance hasn’t changed
- Ensuring you have ample cash for expenses you anticipate needing in the next twelve months
- Rebalancing when needed
- Stress-testing plans for higher inflation, interest rates, or volatility
Corrections and geopolitical uncertainty are emotionally challenging, but they do not typically necessitate a change of a long-term strategy. History shows markets have endured wars, inflation shocks, political shifts, and policy mistakes while long-term investors who remained diversified and disciplined continued progressing toward their goals.
We are closely monitoring risks, but abandoning a thoughtful strategy in response to short-term volatility has often caused more damage than volatility itself. As always, we are happy to talk this (or anything else you may be hearing about) through with you and how it may be impacting your specific portfolio or financial plan. Please don’t hesitate to call.
Sincerely,
The S. Harris Financial Group
S. Harris Financial Group, LLC is a registered investment advisor.
This report was prepared by S. Harris Financial Group, LLC., and reflects the opinion of the authors. It is based upon sources and data believed to be accurate and reliable. Opinions and forward-looking statements expressed are subject to change without notice. The information contained in this report does not purport to be a complete description of the securities, markets, or developments referred to in this material. The information has been obtained from sources considered to be reliable, but we do not guarantee that the foregoing material is accurate or complete. S. Harris Financial Group and its advisors do not offer tax or legal advice. You should discuss any tax or legal matters with the appropriate professional.
Investing involves risk and you may incur a profit or loss regardless of the strategy selected. Past performance does not guarantee future results.
This information does not constitute a solicitation or an offer to buy or sell any security.
1Source: FactSet, FTSE Russell, Standard & Poor’s, J.P. Morgan Asset Management. All calculations are cumulative total return, not annualized, including dividends for the stated period. Correlation to Treasury yields are trailing 2-year monthly correlations between S&P 500 sector price returns and 10-year Treasury yield movements. Next 12 months (NTM) earnings growth is the percent change in next 12 months consensus analyst earnings estimates compared to last 12 months earnings, provided by FactSet. Forward P/E ratio is the most recent S&P 500 index price divided by consensus estimates for earnings in the next 12 months, provided by FactSet. Dividend yield is calculated as the next 12 months consensus dividend, provided by FactSet, divided by most recent price. Beta calculations are based on 10-years of monthly price returns for the S&P 500 and its sub-indices. *Communication Services (formerly Telecom) averages and beta are based on 5-years of data. Past performance is no guarantee of future results.
2Source: FactSet, Standard & Poor’s, J.P. Morgan Asset Management. Returns are based on price index only and do not include dividends. Intra-year drops refers to the largest peak-to-trough decline during the year. Returns shown are calendar year returns from 1980 to 2025, over which the average annual return was 10.7%. Past performance is no guarantee of future results.
Guide to the Markets – U.S. Data are as of March 24, 2026.