Covid-19 and fears about the election, among other events of 2020, disrupted the U.S. economy and brought the longest bull market run in history to an end. If the volatility driven by continued disheartening news caused you to lose sleep, you would not be alone. Even more surprising for many is that almost a year later we find the market hitting new highs and there is talk of a potential economic recovery in 2021. Many investors experienced their first bear market, or their first one in a while. As a reminder, bear markets are defined as declines of 20% or more from the most recent high, while bull markets are increases of 20% or more from the bear market low. So, what lessons can investors learn from 2020 and the global pandemic?
Lesson 1: Keep your long-term goals in mind to avoid emotion-based decisions
The events of last year had many investors feeling nervous and liquidating their positions in the market, as there was a rush to “safety.” Money flowed out of the stock market and into either the bond market or, more likely, bank accounts. Unfortunately, this is a common occurrence in times of fear, and the reality is that many people missed some of the best market days in the last decade. Instead, we remind clients that the only monies we typically have invested in the stock market are funds we anticipate them using in 5+ years, so keeping a long-term focus is important. For example, as the chart below illustrates, a portfolio of 50% stocks and 50% bonds had positive returns in every rolling 5-year period dating back to 1950. Therefore, if your allocation is in line with your risk tolerance and you can remember that the stock market is for your longer-term needs, it can help you stay focused on the importance of staying invested.
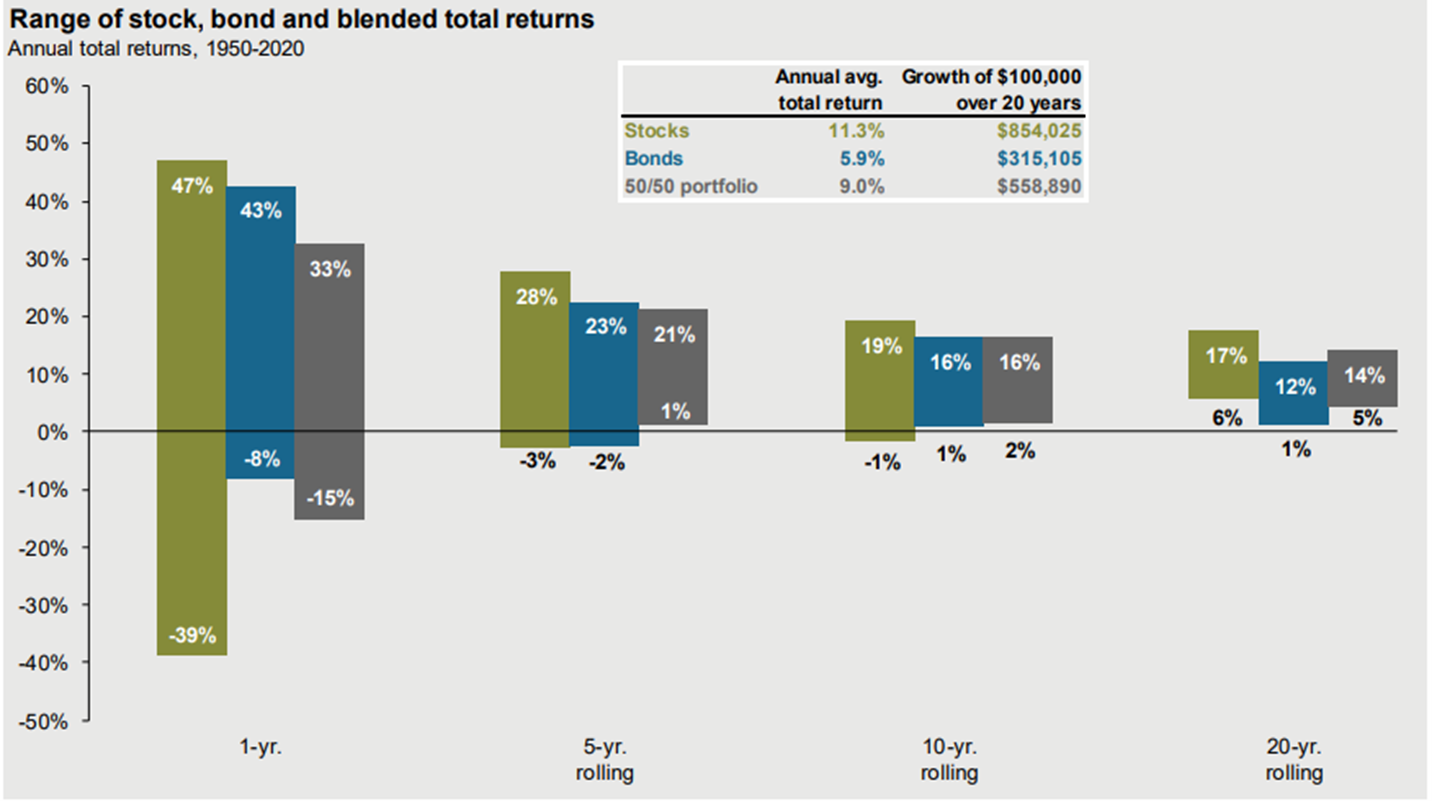
See Disclosure #1
Lesson 2: Make sure your portfolio matches your risk tolerance
The chart below illustrates investment returns in the market each year from 2006 to 2020, ranking the best performing parts of the market from top to bottom. In addition, the last two columns on the right show the annualized return and volatility/risk (respectively) of the different parts of the market between 2006 and 2020. Remember that there was a flight to “safety” in the first quarter of 2020, when many investors got out of the stock market and moved their money to cash or bonds? Note that cash was the 3rd worst performing asset class in 2020, followed by commodities and real estate. In other words, if investors did not reinvest their funds rather quickly back into the stock market, they likely missed significant upside in the second through fourth quarters.
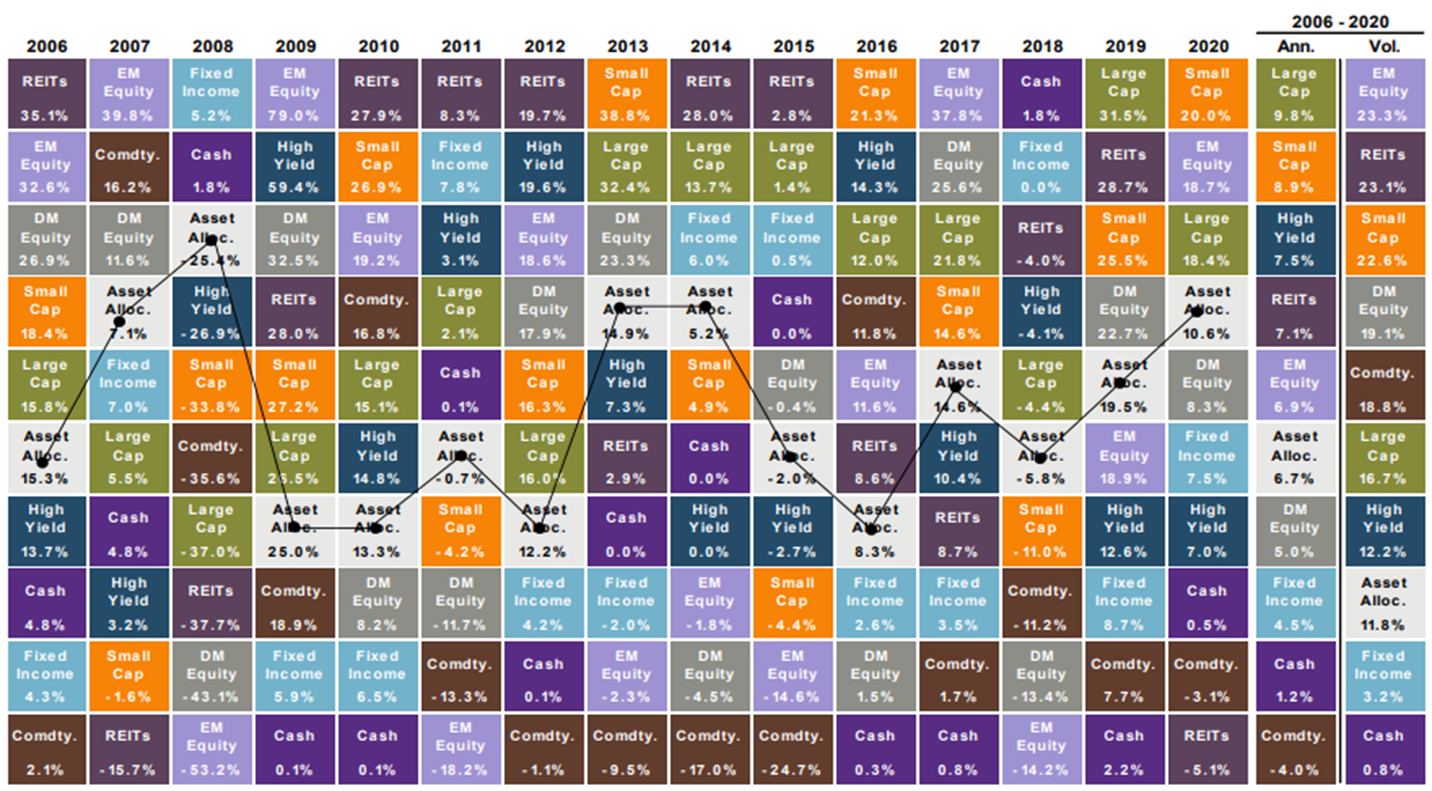
See Disclosure #2
Instead, we utilize the concept of diversification to build a portfolio for clients that is in line with their risk tolerance. You can see from this chart that a diversified (“Asset Allocated”) portfolio, represented by the light gray squares, reduces the roller coaster ride of returns, and therefore increases an investors chance of being able to ride out the storm when the markets get volatile.
Lesson 3: Avoid the temptation to time the market
The desire to liquidate holdings or invest funds when you believe something is going to happen in the short-term rarely proves to be an effective strategy. There are many times in history that headlines could make one weary of investing, but hindsight shows us that people sitting out of the market experienced significant opportunity cost during many of those times. To successfully “time the market” you must make two great calls; when to sell and when to buy back in. Individuals rarely make both those calls correctly. One reason it is so hard to get back in is that many of the best days in the market occur amongst the worst times in the market and missing those days can have devastating impacts on investor returns over time. The chart below shows 20 years of data for the S&P 500 through the end of 2019. It shows an investor’s return on a $10,000 investment if they were fully invested (left bar), or missed the 10, 20, 30, 40, 50, or 60 best days in the market over that time.
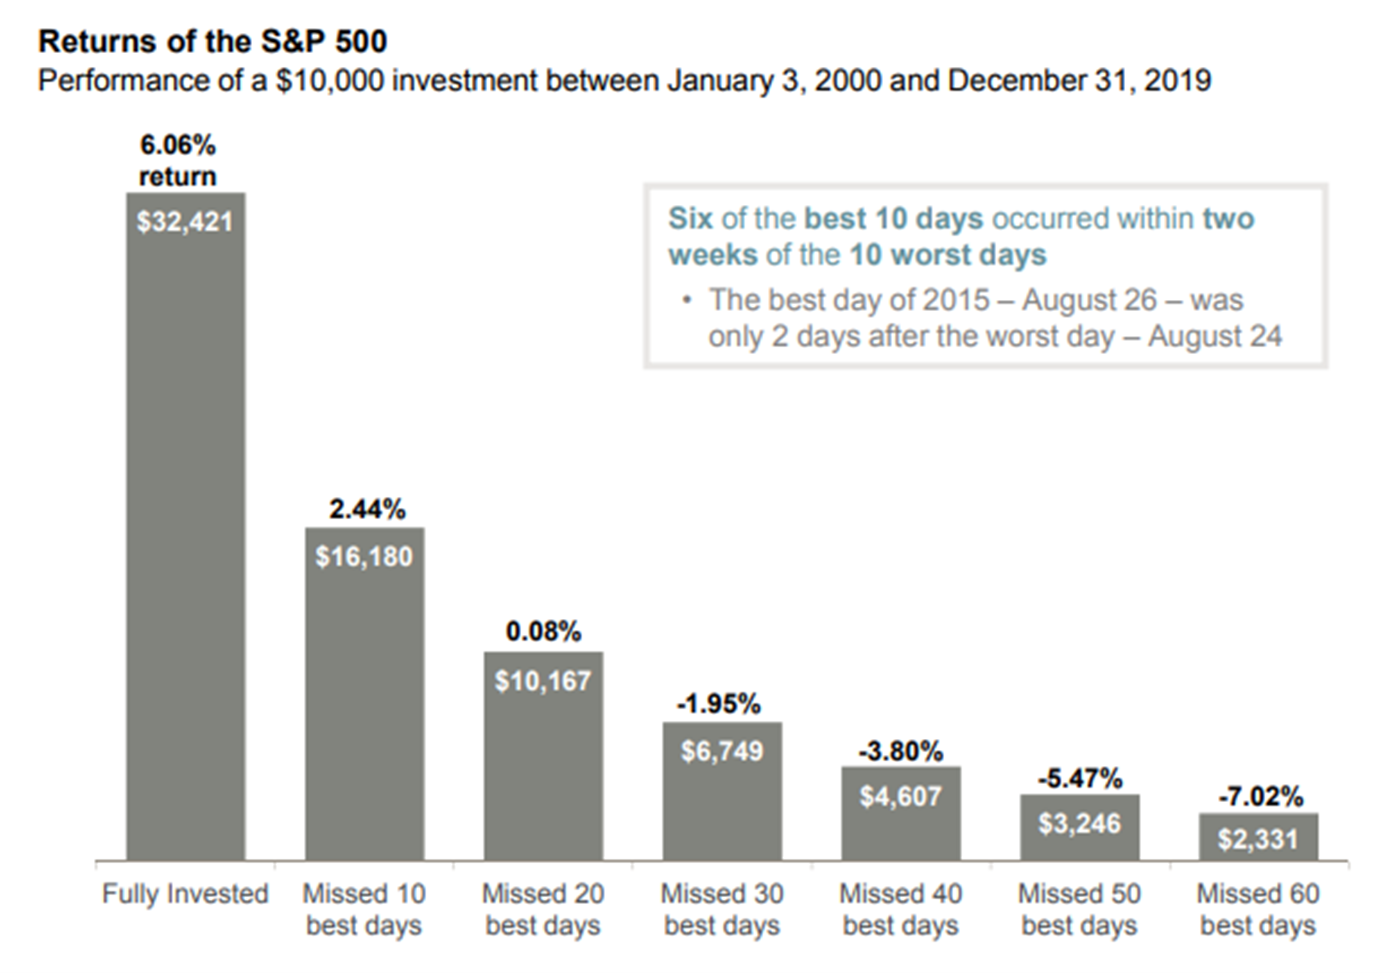
See Disclosure #3
You might be thinking that you would have to be unlucky to miss even the 10 best days over 20 years, and we would agree. However, from January 3rd, 2000 to April 19th, 2020, six of the seven best days occurred after the worst day and seven of the ten worst days were followed the NEXT DAY by either top 10 returns over the 20 years OR top 10 returns for their respective years. The point being, when the markets turn, they often turn very quickly and that is exactly what happened in 2020.
Does this mean we recommend putting all your money in the stock market then never touching it again? Absolutely not, as plans need to be adjusted to your goals and risk tolerance over time. However, we believe a well-thought-out diversification strategy and periodic rebalancing is still the fundamental basis of a good investment plan. In times of uncertainty, sticking to a disciplined investment approach utilizing strategic, diversified asset allocation will hopefully allow you to benefit from those best days in the market that can be critical to a portfolio’s long-term performance.
The S. Harris Financial Group
Securities offered through Raymond James Financial Services, Inc., Member FINRA/SIPC. S. Harris Financial Group is not a registered broker/dealer and is independent of Raymond James Financial Services. Investment advisory services offered through S. Harris Financial Group.
Raymond James Financial Services does not accept orders and/or instructions regarding your account by email, voice mail, fax or any alternate method. Transactional details do not supersede normal trade confirmations or statements. Email sent through the internet is not secure or confidential. Raymond James Financial Services reserves the right to monitor all email.
Any information provided in this email has been prepared from sources believed to be reliable but is not guaranteed by Raymond James Financial Services and is not a complete summary or statement of all available data necessary for making an investment decision. Any information provided is for informational purposes only and does not constitute a recommendation. Raymond James Financial Services and its employees may own options, rights or warrants to purchase any of the securities mentioned in this email. This email is intended only for the person or entity to which it is addressed and may contain confidential and/or privileged material. Any review, retransmission, dissemination or other use of, or taking of any action in reliance upon, this information by persons or entities other than the intended recipient is prohibited. If you received this message in error, please contact the sender immediately and delete the material from your computer.
Any opinions are those of S. Harris Financial Group and not necessarily those of Raymond James.