Last week our team had the opportunity to attend Raymond James’ national conference in Nashville, Tennessee. Due to COVID, this was the first time in three years that we were able to meet in person, and we all appreciated the ability to hear market and economic updates from industry experts, share best practices with other leaders, and gain wisdom on how to best serve our clients.
Since May has continued to test our appetite for risk, we thought we would share a consensus of what we heard from economists, money managers, and industry experts:
- With recent inflation data released, it appears as though the Fed Funds rate increases thus far seem to be slowing down inflation as hoped and expected. Although we may not have seen the peak of inflation yet, we anticipate there will be another 0.5% rate increase in June and July to help further dampen inflation. However, it could be at least two or three years before we see inflation back in line with the Fed’s target of 2-3%.
- Although you are likely hearing the “R” word (“Recession”) more in the media, current economic indicators signal that recession is not likely in 2022, or even the first half of 2023. It’s also interesting to note that a recession has never started during the 3rd year of a presidential term (next year).
- Analysts are still optimistic that corporate profits will be up in 2022 and 2023 based on current data. Therefore, the consensus is that the stock market could be up approximately 10% from where it is today before the end of the year (in other words recovering approximately 2/3 of this year’s losses thus far).
- The recent negative news on earnings for major stock retailers was not surprising to many economists. Retail sales since COVID had increased approximately 4x the normal pace prior to COVID, and that didn’t seem likely (or healthy) to last at that pace. Instead, we are seeing that consumers appear to be on a glide path back to normalization, and we expect a shift from goods to services.
- The bond market has had losses in the first part of this year due to the Fed’s significant change in timing and number of rate increases. However, many believe most of the impact has already been priced into the bond market, and therefore are hopeful bonds will provide more cushion to down markets in the remainder of the year.
- There could be more volatility in the summer and early fall as we prepare for a mid-term election. Historically, markets have not performed drastically different under Republican or Democrat leadership, but a balance of power in the three branches has led to better performance due to the gridlock it typically provides.
- The year-to-date returns are close to triggering the definition of a “Bear Market”, which is a prolonged decline of the market in which securities prices fall 20% or more from a recent high. When these phrases are used, it is natural to create discomfort or anxiety. Remember, though, that since 1942 the average Bear Market has lasted only 11.3 months with an average cumulative loss of 32.1% while the average Bull Market endured 4.4 years with an average cumulative total return of 154.9%. Since the bottom of Bear Markets in hindsight were often found in the midst of fear-invoking headlines, it is important to focus on your long-term goals and not be tempted to change course during these times
We wanted to share the following visuals to demonstrate the importance of “staying the course”:
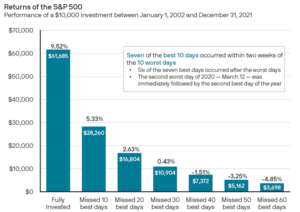
- The importance of staying invested is demonstrated below. Losses tend to make us feel bad more than gains make us feel good, so market lows can result in emotional decision making. The impulse to take “control” of your finances by selling out of the market after the worst days is likely to result in missing the best days that follow. Instead, investing for the long term (the left bar) in a well-diversified portfolio can result in a better retirement outcome.

Source*: J.P. Morgan Asset Management – see below.
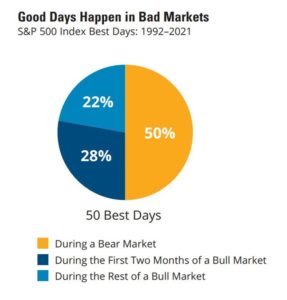
- As you can see from the pie chart below, 50% of the best days over the last 30 years happened during a Bear Market, and an additional 28% of the best days happened in the first two months after the bottom of the market.
 Source: Good Days Happen in Bad Markets; Hartford fund “Client Conversation – Timing the Market is Impossible
Still feel like you need to do something about your current financial picture? Here are our suggestions:
– Make sure you have enough cash on the sidelines to cover any expenses you expect over the next 12 months. If you need to discuss this with us, please feel free to reach out.
– Consider looking at your budget to determine if there are any expenses you can reduce or eliminate. These periods of uncertainty are often reminders that we need to make sure our expenses are aligned with our values.
We continue to monitor the markets and your holdings and will be reaching out to you periodically. In the meantime, please don’t hesitate to call us if you would like to understand how the market conditions are impacting your plan. We take our responsibility for managing your portfolio very seriously and are grateful for your trust to do so.
The S. Harris Financial Group
Securities offered through Raymond James Financial Services, Inc., Member FINRA/SIPC. S. Harris Financial Group is not a registered broker/dealer and is independent of Raymond James Financial Services. Investment advisory services offered through S. Harris Financial Group.
Raymond James Financial Services does not accept orders and/or instructions regarding your account by email, voice mail, fax or any alternate method. Transactional details do not supersede normal trade confirmations or statements. Email sent through the internet is not secure or confidential. Raymond James Financial Services reserves the right to monitor all email. Any information provided in this email has been prepared from sources believed to be reliable but is not guaranteed by Raymond James Financial Services and is not a complete summary or statement of all available data necessary for making an investment decision. Any information provided is for informational purposes only and does not constitute a recommendation. Raymond James Financial Services and its employees may own options, rights or warrants to purchase any of the securities mentioned in this email. This email is intended only for the person or entity to which it is addressed and may contain confidential and/or privileged material. Any review, retransmission, dissemination or other use of, or taking of any action in reliance upon, this information by persons or entities other than the intended recipient is prohibited. If you received this message in error, please contact the sender immediately and delete the material from your computer.
Any opinions are those of S. Harris Financial Group and not necessarily those of Raymond James.
S&P 500 Index is a market capitalization-weighted price index composed of 500 widely held common stocks.
Important Risks: Investing involves risk, including the possible loss of principal.
Source *: J.P. Morgan Asset Management analysis using data from Bloomberg. Returns are based on the S&P 500 Total Return Index, an unmanaged, capitalization-weighted index that measures the performance of 500 large capitalization domestic stocks representing all major industries. Indices do not include fees or operating expenses and are not available for actual investment. The hypothetical performance calculations are shown for illustrative purposes only and are not meant to be representative of actual results while investing over the time periods shown. The hypothetical performance calculations are shown gross of fees. If fees were included, returns would be lower. Hypothetical performance returns reflect the reinvestment of all dividends. The hypothetical performance results have certain inherent limitations. Unlike an actual performance record, they do not reflect actual trading, liquidity constraints, fees and other costs. Also, since the trades have not actually been executed, the results may have under- or overcompensated for the impact of certain market factors such as lack of liquidity. Simulated trading programs in general are also subject to the fact that they are designed with the benefit of hindsight. Returns will fluctuate and an investment upon redemption may be worth more or less than its original value. Past performance is not indicative of future returns. An individual cannot invest directly in an index. Data as of December 31, 2021.